Cameyo's support team may request that you submit a virtualization engine log. This helps diagnosing virtualization issues. There are two ways of generating these logs:
A. Virtualization log method #1 (-Troubleshoot)
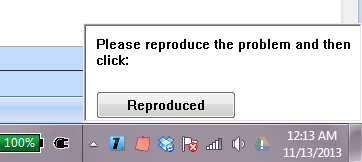
By running the virtual application with the "-Troubleshoot" parameter, you will see the following screen. Simply reproduce the problem and click "Reproduced". Send the resulting log.
B. Virtualization logging method #2 (CameyoTracer)
This will generate a log similar to the -Troubleshoot method above. This procedure is helpful when the above doesn't work, or when you need to narrow the log to a specific point in time.
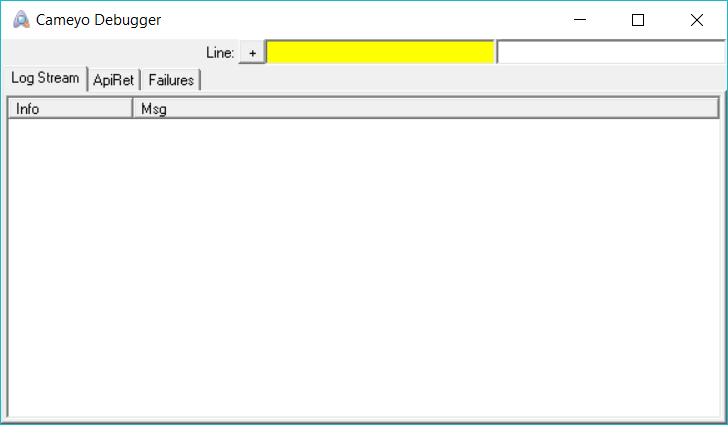
First you need to download and run https://files.cameyo.com/downloads/CameyoTracer.exe. The following screen will appear:
The procedure is then:
1.Launch the virtual application (CameyoTracer must be running before you start the virtual application).
2.Reproduce the problem. As soon as the problem is reproduced, quickly press Ctrl-E to stop logging. You will see the text "Logging" change into "Stopped logging".
3.Press Ctrl-S to save the log.
4.Compress and send the resulting log to the Cameyo team.
Important: CameyoTracer substantially slows down the virtual application's execution. If the application takes too long for you to get to the problematic event, you can disable logging (Ctrl-E) right before step 1, and re-enable it (Ctrl-E) just before step 2 (just before starting to reproduce the problem). This will yield a much shorter log and faster execution.
C. Process monitor
In addition to a virtualization log, it is often useful to provide a Process Monitor log to be able to thoroughly diagnose virtualization issues. Process Monitor is specifically helpful for diagnosing virtualization issues related to registry virtualization.
Process Monitor is a diagnosis tool from Microsoft TechNet. It can be downloaded from http://technet.microsoft.com/en-us/sysinternals/bb896645.aspx
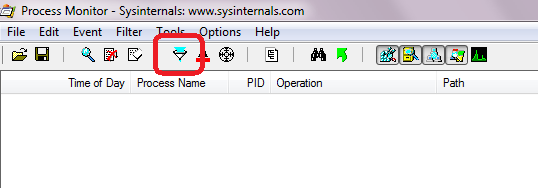
•Download and launch Process Monitor. Press the "Filter" button:
•The following filter screen will appear:
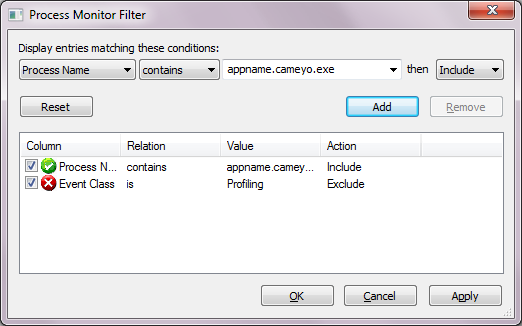
•Click the "Reset" button.
•Choose "Process Name" on the top left drop-down list. Then choose "contains" and then enter the relevant process name (see remark below). Click "Add", and "OK".
•Choosing the relevant process name is important: if your application is virtualized in RAM mode, this will generally be the same as the .cameyo.exe filename. If it is in Disk mode, it will be the same process name as the original (non-virtualized) application process. If you are unsure, try first to let Process Monitor run without any filter (Cancel and come back to it later), and see which of the virtual application's process produces the relevant log lines.
•Reproduce the problem.
•Stop the logging (Ctrl-E) and save the log file (Ctrl-S)
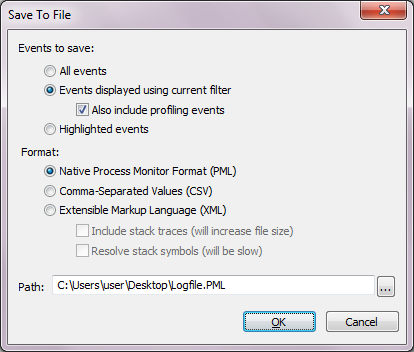
•Leave the saving dialog's options by default ("Events displayed using current filter" and "Native Process Monitor Format (PML)").
•Click "OK", compress resulting PML log file and send it to the Cameyo team.